August 28, 2010 / dw / Comments Off on Clean Energy from the Ocean: The Mid-Atlantic Wind Park
Drew Murphy, Northeast Region President of NRG Energy Inc., presented the August 19, 2010 lecture in the University of Delaware’s Coastal Currents Lecture Series. NRG owns offshore wind energy developer NRG Bluewater Wind. Mr. Murphy’s excellent presentation on the company’s planned “Mid-Atlantic Wind Park” project off the Delaware coast provided guests with a broad perspective on the challenges to as well as the economic, environmental and energy-related benefits from developing an offshore wind park.
His presentation helped answer questions I hear quite often: “How can offshore wind be developed in the US?”, “Why is offshore wind a good source of clean and reliable energy?” and “How are they able to install wind turbines so far out in the water?”.
Before this talk, I had no clue about some of specialized vessels and equipment used in the offshore wind projects. Thanks to Mr. Murphy I now have some insights on how it might be accomplished, and why it would be good for Delaware and for the entire country.
I appreciate NRG’s permission to post this interesting presentation online. You can find out more about the company’s offshore wind and other clean and renewable energy development efforts by visiting http://www.nrgenergy.com.
Last week we had just received the UD-134 glider (aka the “Blue Hen”) from two tours of duty in the Gulf of Mexico in collaboration with IOOS and Rutgers University for the Deepwater Horizon Oil Spill Response project. To prepare for an upcoming Antarctic mission, we needed to get some work done on UD-134 at the source – Teledyne Webb Research in Massachusetts. Since we were only five hours south of Webb at the time, I loaded the Zune HD (with purely educational podcasts of course – in this case Security Now) and it was road-trip time for me and two of the students from the ORB lab.
The students who went with were really excited to get to learn from the masters while we tore down UD-134 at Rutgers. (For those new to gliders, Rutgers is the undisputed kings of the glider realm, they’ve been flying them since, like forever). One of the students who came with was a summer intern who was charged with learning how to pilot the Glider over the summer. Because of the last-minute deployment of UD-134 in the Gulf, he had lots of pilotting time on a simulator, but not so much hands-on with real Gliders. The other student was a new grad student who would be responsible for ingesting and processing glider data, so she was looking forward to the trip as well. When we decided at the last minute to head up to Webb Research to deliver the components, the intern said he “felt like Willie Wonka with the winning ticket to tour the chocolate factory”. He was definitely not disappointed as Peter Collins met us at the doors of Webb and gave the students and I the grand tour.
Peter Collins (aka “Texas Pete” for this post) donned his cowboy hard hat and headed to the ballast tank with me and a couple of our students last week to do a quick talk for Ocean Bytes. Pete gave a quick introduction to the Slocum Electric Glider – an Autonomous Underwater Vehicle (AUV) or Underwater Glider that is made by Teledyne Webb Research. Take note that the glider that Pete has in front of him as it is a tad different from most in that it has two science bays (there is usually only one). This one is being fitted with a Photosynthetically Active Radiation (PAR) sensor and a FIRe sensor (remember Lauren’s video?) from Satlantic. I’ll hand you to Peter now so he can discuss what a glider is for and how it works…
In addition to the lineup of first generation gliders, we were introduced to the second generation gliders that are just now being manufactured – also called the “G2” gliders. I’ll try to cover everything that we learned about the G2 systems in a future post.
Thanks again Peter for the awesome hospitality and for taking such great care of us!
Note: Getting lots of inquiries as to where one might obtain “Cowboy Hard Hats” – Peter provided a couple of links to possible suppliers – Link 1 and Link 2.
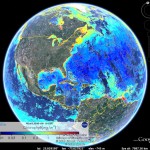
As a new grad student in the ORB (Ocean exploration, Remote Sensing, and Biogeography) lab at the University of Delaware under Dr. Matthew Oliver, I (along with my cohort Danielle Haulsee) were tasked with learning to write code in R. R is a language that enables statistical computing and making graphical displays. To some of you this may sound basic, but having no prior programming experience it was a little overwhelming at times. After getting the basics down, we then started pulling sea surface temperature and chlorophyll data from NASA’s Goddard Space Flight Center (GSFC) MODIS Aqua satellite. This isn’t just any temperature and chlorophyll data either, it’s real-time and updated everyday! From this we were able to create maps on Google Earth, which is a great platform for viewing and interacting with multiple data layers on a global scale. This allows us to easily distribute NASA’s data for ocean planning. These overlays along with others were also able to assist in planning Slocum Glider missions in areas surrounding the Gulf oil spill.
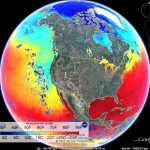
In our Google Earth maps, we created 1, 3, and 8 day averages that reflect the current conditions in the ocean. Each day our code downloads the lastest satellite data that has been updated on NASA’s website and then it is averaged along with the previous days to create an average. The 1 day average maps are patchy due to the fact that the satellites can not see through the clouds. Therefore, the 8 day averages make for a more complete and accurate picture. For higher resolution images, we created smaller maps of just California, the East Coast and even Antarctica! These locations correspond to areas that we conduct further research in. Google Earth was interested in our overlays so check out the Google Earth Gallery for sea surface temperature and chlorophyll concentrations near you!
Some students and I went on a road trip to Rutgers University in New Jersey and then ended up heading up the coast to East Falmouth, Massachusetts to meet with the fine folks at Teledyne Webb Research. During a tour of the facilities, we were introduced to the APEX floats, whose data (through the ARGO program) the students were accessing for various projects in the ORB lab. James Truman, an engineer at Webb, graciously agreed to do a quick 101 overview of the APEX on camera.
Profiling floats like the APEX are able to sink or float by varying their internal volume. A standard equation for Buoyant Force is:
F(buoyant) = –pVg
where p=density of the fluid, V=volume of the object (in this case the float) and g=standard gravity (~9.81 N/kg). By adjusting the internal volume of the float by pumping fluids in and out of the interior, we are able to make the device either more or less buoyant. There’s a really neat cut-away animation on the UCSD Argo site that shows the guts of the units quite well.
Float technology has evolved rather quickly, with the original floats only serving as a mechanism for tracking deep ocean circulation – also called Lagrangian Drifters or ALACE (Autonomous Lagrangian Circulation Explorer) floats. They would pop up to the surface and transmit back their positions and the temperature at depth. Using the drifters last known position and its new position gave scientists an idea of how fast and in what direction the deep ocean currents were moving. Later these drifters were equipped with CTD sensors (Conductivity-Temperature-Depth) and they took sensor readings all the way up the water column and transmitted a “profile” reading back to the mother ship. These were called PALACE or “Profiling ALACE” floats (see WHOI’s site on ALACE, PALACE and SOLO Floats).
NOAA has a site called ARGO KMZ Files that makes it really easy to get started tracking ARGO floats and their data. You just need to install Google Earth first – which can be downloaded at: http://earth.google.com/. Below is a screen shot of the ARGO floats in the Atlantic.
Thanks again to James Truman and the awesome people at Webb Research for taking us under their wing and spending a lot of time showing us the ropes. It was an excellent experience that the students are still talking about.
It has been a great pleasure to have Lauren Wiesebron on the Lewes campus this summer. Lauren is a summer intern from Johns Hopkins and is here as part of an NSF funded Research Education for Undergraduates program (aka REU). For her summer project, Lauren worked in Dr. Matt Oliver’s lab (the ORB Lab) and chose “photosynthetic efficiency” as her summer research project. To gather data for her project, she set up shop in a portable scientific lab van on the dock in which she set up a Fluorescence Induction and Relaxation System (FIRe Sensor), a Coulter Counter and a Submersible Ultraviolet Nitrate Analyzer (SUNA). Dr. George Luther’s lab was also taking readings from the same lab van and Lauren included some of their data into her analysis. The past few weeks Lauren analyzed the results and tomorrow she will present a talk called “Conditions for increased photosynthetic efficiency in an estuarine area”. Here is a walk-through of the lab van that I did earlier this week with Lauren.
Excellent work Lauren and we hope to see you back here for Grad school!
I lucked out not too long ago and happened to be at the right place at the right time (usually it’s the other way around). I ran into Brian Kidd, our resident expert on Multibeam Echosounder systems (also known as a Swath system) and he said he just happened to have the multibeam components apart for servicing. I ran to get my camera and followed Brian around and asked all kinds of insightful questions (of course). Echosounders are a version of Sonar (which stands for SOund Navigation And Ranging) wherein a transmitter emits a sound pulse downward into the water and then the amount of time that the pulse takes to come back to the ship is measured. A single beam echosounder will shoot a beam straight down and and use a single receiver to receive the pulse that bounced back from the bottom of the body of water. This is used to determine how deep the water is beneath the ship. A multibeam echsounder will emit a broad pulse of sound into the water and then will use multiple receivers aimed at various angles to measure the reflected sound. These times are then processed by the computer to generate a “swath” beneath the ship and at some distance to either side which shows the height of the sea floor. Moving the ship forward will give a band of height information beneath the ships track, and by moving in parallel, overlapping tracks, an ever-growing patch of sea floor heights can be mapped.
Okay, I’ve exhausted my general knowledge of the subject. I’ll let Brian take the reigns and kick back and learn from the master…
At the 2009 RVTEC meeting, I sat in on the Swath/Multibeam workshop and updated the Swath/Multibeam section of OCEANIC’s International Research Vessels database for the UNOLS vessels. There were some huge swath transducer arrays being discussed at the workshop on some of the deep water vessels, so I was pretty surprised to see just how compact the shallow water multibeam systems can be. In the second part of the video, Brian shows us what the Reson Seabat 8101 transducer assembly looks like and how they mount the unit to the ship.
Many thanks to Brian for putting up with me and for taking time to share his knowledge of the Reson Seabat 8101 Multibeam System (PDF of specs here) onboard the RV Hugh R. Sharp.
Why two videos and not one? Apparently YouTube has a 10 minute max length for uploaded videos, so I broke the video into two parts. Part 1 covers the monitoring and display station and Part 2 covers the mounting infrastructure and the transducer assembly. This works well for me as I doubt that too many people are able to sit through a 20+ minute video anyways, so breaking it up into two more digestible chunks is better in my opinion.
August 7, 2010 / dw / Comments Off on Portable “Castaway CTD” by YSI
How many times have you been standing on a dock or a bridge or even out on a kayak or large research vessel and found yourself wondering what the temperature, sound and salinity profile was for the water beneath you? Well, you need wonder no more!
Here’s the last of the videos from the BEST Workshop last week. I talked with Chris from YSI about their new product the portable “Castaway CTD”. Just a tad larger than your standard handheld GPS, the Castaway CTD is a battery operated unit that allows you to do on-the-spot CTD casts at depths up to 100 meters. Chris did a quick rundown of the unit and its operations and then we stepped inside to see what software they are supplying to pull the data off the units, manipulate it and export it for use. Again the venue was quite noisy, so my apologies for the poor sound quality.
Specs for the unit are available on the YSI site, just click on the “Specifications” tab. The unit runs on two AA batteries, which they claim will run the unit for over 40 hours. Communications with the unit are via an internal BlueTooth radio and the unit ships with a tiny USB BlueTooth dongle for you to use in your computer. The recorder comes with 15MB of storage, which they claim will store over 750 casts. It contains a built-in GPS so that you can get a geographic fix on your location within 10 meters and it will record the following:
Conductivity
Pressure
Temperature
GPS
Salinity (derived)
Sound Speed (derived)
A PDF of the whitepaper for the unit can be downloaded here.
August 6, 2010 / dw / Comments Off on Scanfish Undulating Towed Vehicle
Lucky me, I happened to be in the right place at the right time. I was over at the CEOE Marine Operations Building and I ran into Brian Kidd, a marine technician aboard the RV Hugh R. Sharp. Brian is the resident expert on multibeam echosounder systems and he agreed to talk on camera about some of the data acquisition systems that he’s involved with. While we were talking I noticed that the Scanfish was opened up and getting prepped for an upcoming science mission, so Brian volunteered to talk about the Scanfish as well. The segment on the multibeam is a tad longer as we had to do some travelling around the ship and ashore to cover the various components as it was being serviced. The multibeam video will be posted shortlyhas been posted and is available here.
Background:
The Scanfish was originally a product of GMI of Denmark. GMI was purchased by EIVA, who integrated the Scanfish into their suite of hardware and software solutions in support of marine science and surveying. EIVA hosts a PDF showing specs for the Scanfish MK II on their site. The MK II looks like it is the equivalent of the Scanfish we discussed with Brian. EIVA also provides smaller Scanfish units including the Scanfish Mini and the Scanfish MK I.
The Scanfish is “flown” and monitored via a conductive cable that feeds data and parameters back to EIVA’s “Flight Software” – which the technician uses to control the Scanfish, the winch and to display and log the data being collected.
In addition to housing a CTD (which stands for Conductivity + Temperature + Depth) sensor, the Scanfish also supports the following optional sensors:
HASS is a small hydro-jet powered boat a tad over 4 feet long. Its claim to fame is that it has the ability to approach marine mammals at a much closer proximity than is allowed via standard surface ships and that it will have much less of an impact with its presence due to its small size and electric drive. I shot a video with Tony (my apologies for the poor sound quality – lots of background noise).
HASS has an impressive list of features and capabilities which include:
Hydro-jet powered to prevent damage to marine animals from a propeller
Remotely Operated Camera
Side-scanning Sonar
Electric powered (batteries can be changed in ~5 minutes)
Up to 40 mph speed, with 20-30 typical
Endurance from 2-7 hours depending on operating conditions
Wireless control via a nearby ship (~0.5 mile range) or support for control via iridium satellite phone
As promised, I’m starting to weed my way through a couple of the videos that I shot at the BEST Workshop in Oxford MD (see previous post). My apologies for the poor sound quality – we had a ton of people on the back deck, which created a lot of background noise. Not bad considering I shot it with my cheapy $120 HD video camera though.
This is a recording of a discussion that I had with Chris from YSI about their EcoMapper AUV. It appears that YSI has taken the OceanServer AUV and loaded it with an impressive array of sensor technologies. The system runs Windows XP embedded on the AUV and it simply appears as another computer on the network when you’re interacting with it via wireless communications. I’ll shut up now and let Chris do the talking, he’s the expert.
August 3, 2010 / dw / Comments Off on Bay & Estuarine Sensor Technologies (BEST) Workshop
I was able to attend the 2010 Bay & Estuarine Technologies Workshop (BEST) last week. It was held July 27-30 at the Environmental Science & Training Center at COL in Oxford, MD. Also called the “BEST by the Bay” workshop, this years workshop is a follow-up to last years “AUVs in the Bay I” which was held in June of 2009.
AUV on Display at BEST
I am a first-time attendee and it was well worth the trip. There were some awesome technologies on display at the center, including Buoys, Autonomous Underwater Vehicles (AUVs), Unmanned Surface Vehicles and other technologies that allow for limited human interaction in the collection of water quality data in remote regions of the bays and estuaries. The workshop focused on “the application of sensors used in estuarine systems and storing the data using IOOS protocols so it can be used in environmental forecasting models, such as hypoxia”.
I was only able to attend the Wednesday portion of the program, so I’ll only write about what I saw. After walking around and drooling on many of the AUVs and ROVs on display (lucky they are all watertight) we went around the room and introduced ourselves and the meeting started.
Kids Learning from Art Trembanis
Attendees included a wide gambit of technology vendors, managers, scientists and even educators, students and boy scouts. The head honcho Doug Levin of NOAA quickly took charge and got all of the AUV operators who were going to run a mission on task to program their AUVs for the task at hand. In addition to the science mission, the day also included a keynote and several other presentations throughout the afternoon.
I took a few minutes and recorded a few Question & Answer sessions with some of the attendees. I hope to cobble those together and get them online sometime soon.