That’s the question that we hope to answer with the International Research Ships Schedules & Information project. Imagine with me if you will a site where we can log metadata about the research adventures of all oceanographic research vessels. Think of the opportunities that it would open up for researchers wanting to know who has been exploring in a specific region of the ocean, what they were looking for and, if we can get the metadata exposed, what data they collected with possible links to where it can be discovered. I’m proposing that we continue to develop the pot where all of that ship information and cruise metadata can be cooked, blended together with just the right seasonings (algorithms), and develop the scoops (tools) that would help users, agencies and researchers pull out a portion that suits their needs. I like to call the concept Stone Soup Science. I love the Stone Soup story and think the concept that it conveys in this data context is a perfect fit. (It’s much better than my other depictions – “Show Me The Data!” or <cue AC/DC music>”Dirty Data…Done Dirt Cheap” ;?)
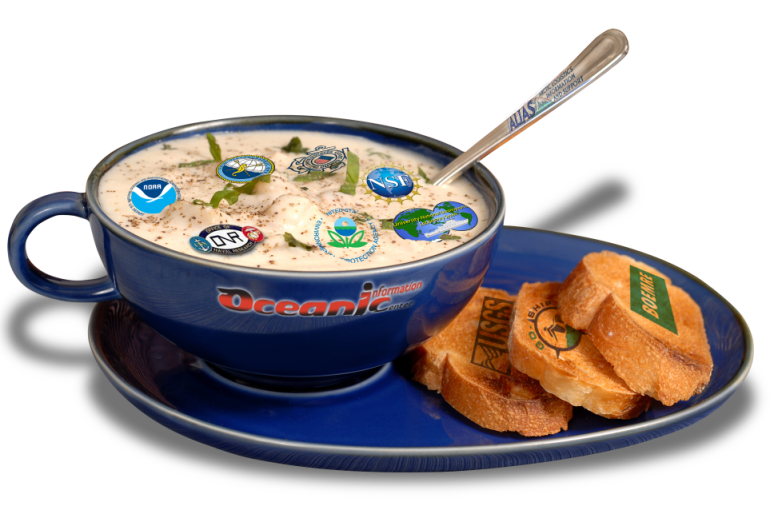
Stone Soup Science
No, I am not proposing that we build a data warehousing site to hold all of the oceanographic data that’s being collected. There are agencies and organizations all of the world that are doing a great job of doing that already. What I am proposing is that we continue the modernization of the Research Vessels site to help users mine for and discover where RVs have operated in the past. The next step would be to expose links to those data warehouses. I certainly wouldn’t want to have to try to comb through the holdings of NOAA, R2R, IFREMER, CSIRO, etc to find out who has been doing what oceanographic research, where they went and when they were there. I think this is a better one-stop RV shop solution. All research vessels would be added to the site, not just vessels over a certain size, not just vessels that belong to a certain agency, not just vessels that specialize in one facet of science. We can create customized views of those most certainly, but they’d be done by creating queries to the vessel database to return just those vessels that are of interest to the user or association.
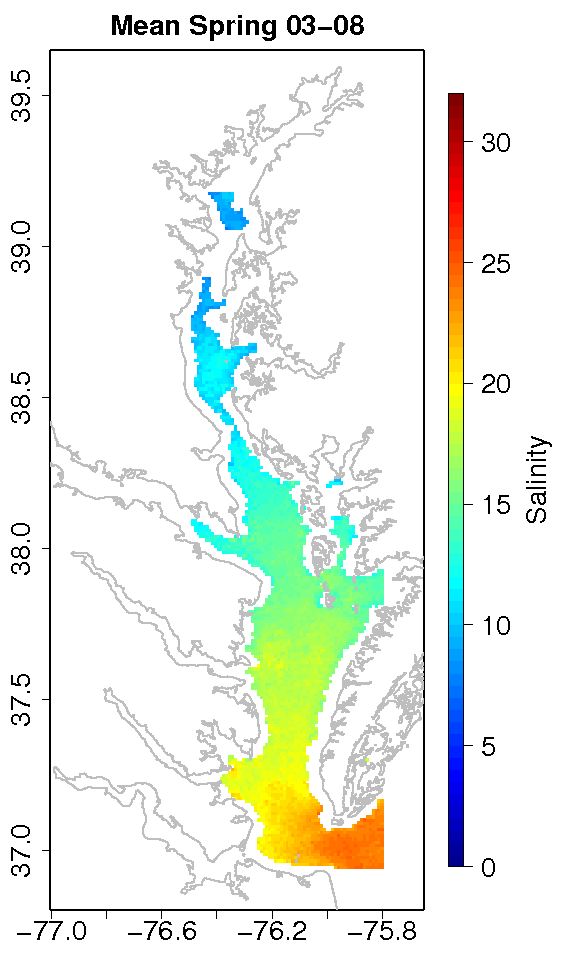
A students Ocean Bytes article shows one of the benefits of being able to leverage and repurpose underway ships data. Eric Geiger pulled together the underway surface mapping data from four regional research vessels to create his satellite salinity modelling algorithm as part of his research thesis. It took Eric a significant amount of time to figure out what research vessels had been working in the region that he wanted to investigate, and even more time to be able to get access to the data that the ships had collected. Imagine if we were able to put together a set of online tools that facilitated that type of investigation. That’s part of what we hope to accomplish with the International Research Vessels Schedules & Information site.
Rather than regurgitate the information on the history and future modernization thoughts on International RV project, I’ll refer you to the About Ships page, which does a pretty good job of explaining things.
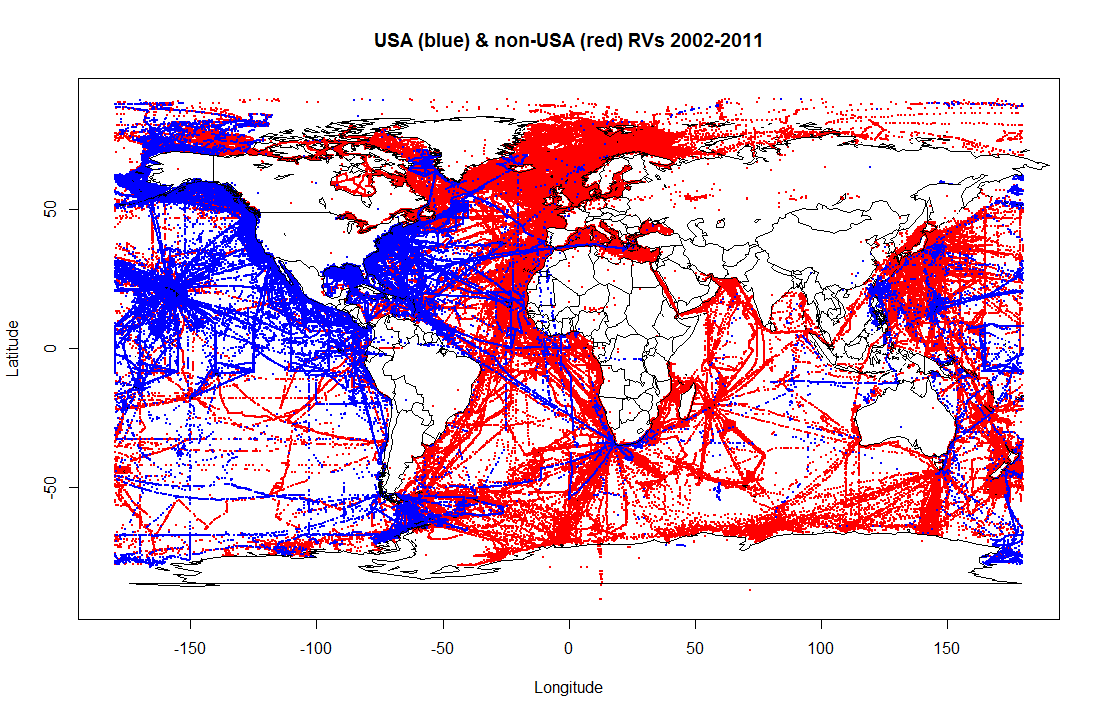
International RV Tracks 2002-2011
The visualization above was a plot that I made of a subset of research vessel cruise tracks from 2002-2011. In blue are the vessels designed as US RVs and in red are the non-US vessels. I think it’s quite intriguing to be able to visualize the locations where we are conducting research, transiting to the location where we plan to research (sensors still collecting underway data) and, sometimes more telling, the gaps in coverage where nobody seems to be going. Many thanks to SailWX.info for the data dump.
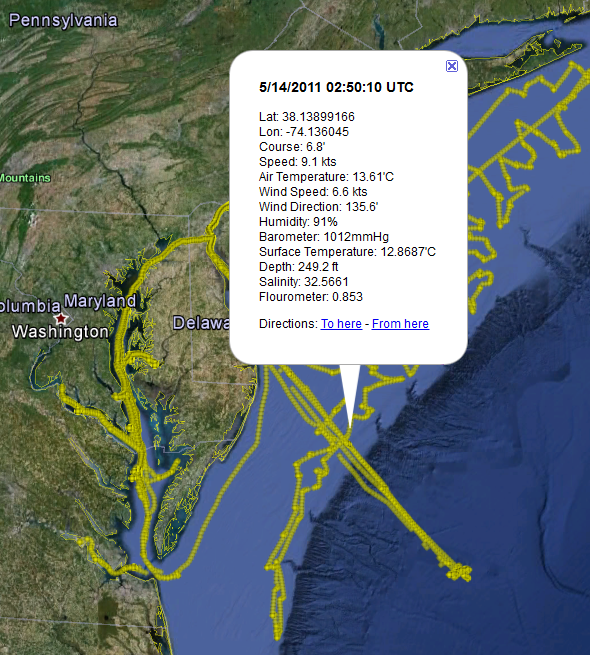
RV Hugh R Sharp Ship Track
A couple of years back, we helped the RV Hugh R Sharp set up a ship-to-shore data transfer mechanism up using their newly acquired fleet broadband. Every hour or so, the transfer scripts zip up the ships underway data files and transfers the data ashore. It dawned on us that we could peek inside the data archive sent ashore, parse out a subset of the ships underway data in 10 minute intervals, and display the ship track and its underway data in near real time. The RV Sharp Ship Tracker site was born out of this effort (see screenshot above). We’d like to prototype a more user customizable open source version of this code and allow others to use the code for their own ships. This data feed could then be pulled into the Research Vessels site to show a higher resolution ship track for the RVs that participate as well as exposing the ships underway data for possible re-use by other students and researchers. For those institutions that already have a ship tracking application in place, we could develop services that would allow for harvesting and repurposing those data as well. The thought would then be to expose all of the ship information, schedule and track metadata via a web api that would allow others to use and repurpose the data as well. Whether it be on their own sites, displaying just a subset of the ships that they are interested in, or for use on mobile apps. Open data!
No Funding
I’ve been involved in the development and operation of the International Research Vessels Schedules & Information project since around 1998 or so. The project was previously funded by a collection of sponsors including NSF, NOAA, ONR, NAVO and the USCG, with each of them contributing funds towards the operation of the project until around 2005. Budget cuts at the time plus the reluctance to share upcoming ship schedules post 911 by some agencies resulted in our program losing its funding. I put the project into hot-standby until funding could be obtained to resume project development and metadata collection. The site stayed online and new ship information was added as it was received, but no major reworks of the site underpinnings happened. I’ve done the dog-and-pony show showcasing the site and its potential to a few groups since then attempting to get funding to move forward and while nearly everybody seemed to agree that the project should be funded, no funding ever came.
Web technologies are advancing at breakneck speeds and it’s time to move this project forward. Funding or no funding. (It’s either that or start working on a Flappy Ships app, make millions, but not contribute towards science ;?)
I’m always open for more help and ideas to maximize the projects capabilities and potential, so if you’d like to lend a hand, do some research, contribute some code, or offer up some other resources (funding, software, training), please let me know by emailing me at info@oceanic.udel.edu. The project needs re-architecting, the data tables need normalizing/denormalizing, the web design needs to be majorly spruced up, new GIS/mapping strategies and tools need to be figured out, ship data needs to be refreshed, web APIs need to be written, etc. Lots to do!
Help me help science!


")

")