Disclaimer: These are the steps that I followed. Please do due diligence and investigate fully before you attempt to modify your own server. Your mileage may vary…
I have a number of websites that run on Windows servers running Internet Information Server (IIS). One of the requirements I pretty much insist on is that if a site allows you to log in, it has to have an encrypted means of communications. We do that by generating a certificate request inside of IIS Manger and sending the certificate signing request (CSR) off to be signed by a certificate provider like GlobalSign, Digicert, etc. The certificate provider with sign the certificate and send you back a blob of text that you can save in a text file with a *.cer extension at the end. You then open up IIS Manager, select the server and Complete the CSR, which installs the certificate on the server. You can then edit the bindings for the website that you want to enable SSL on, add an HTTPS binding and select the certificate.
Easy peasy…you’re done, right? Unfortunately, not quite.
All kinds of security buzz these days about SSL work-arounds and tricks to reduce the security that they provide, funky names like the BEAST attack, POODLE, FREAK, etc. So we want to make sure that the ciphers and encryption techniques that we use are as safe as possible. There are tools available on the web that will hammer your SSL implementation and tell you if there might be any weaknesses. One such online tool is the Qualys SSL Labs test – available at: https://www.ssllabs.com/ssltest/
I ran the SSL Labs scan on a Windows Server 2008 R2 box running IIS 7.5 that I’d just installed a certificate on. The results were not very good with the out-of-the-box settings – an “F” (see below)
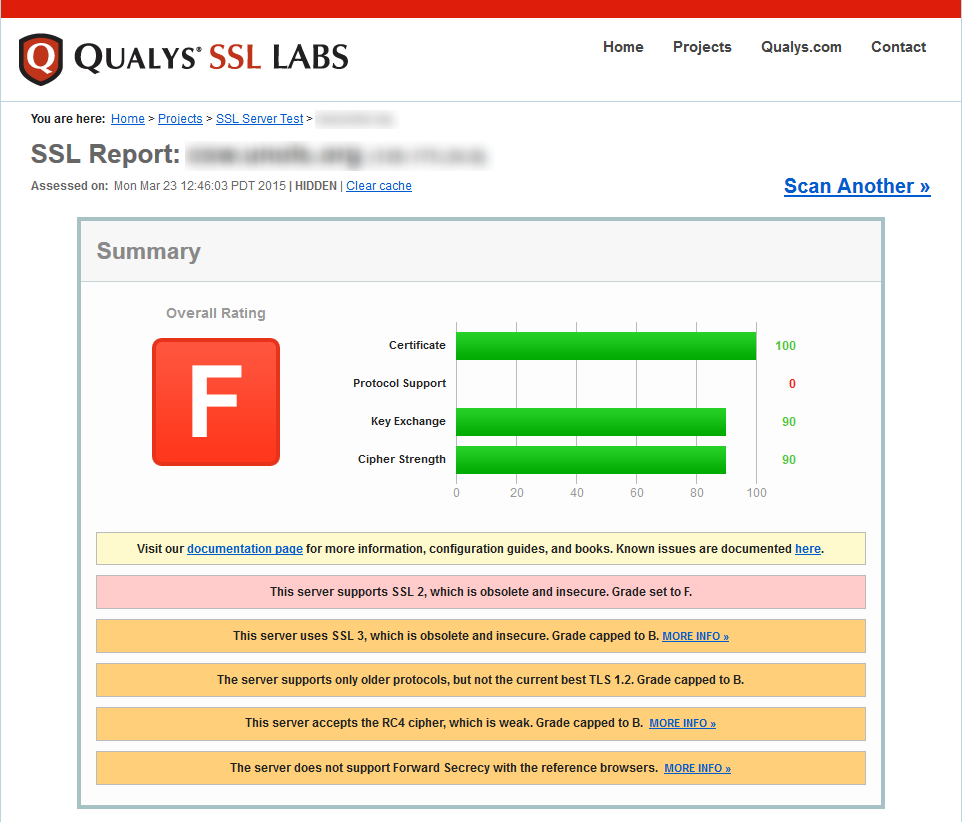
SSL Labs Initial Scan
The report gives us some feedback on what they think the deficiencies are in your site’s SSL configuration and some links to some more info. In the case of this Windows 2008 R2 server, it’s identified:
- SSL 2 is supported – it’s old, it’s creaky, and it’s not to be trusted
- SSL 3 is supported – (see above) and it’s vulnerable to POODLE attack (oh noes – not poodles!)
- TLS 1.2 isn’t supported – TLS 1.1 isn’t either, but they leave that out, we’ll fix that too
- Some of the SSL cipher suites advertised by the server as supported are either considered weak, or they don’t support Perfect Forward Secrecy
The first three items we can fix by editing the registry, the last item requires us to modify one of the group policy settings. The standard disclaimers apply – don’t make any changes to your system unless you are a highly trained professional who understands that these changes may cause your system to no-worky and make sure you have a full backup of the system so that you can restore it if things go sideways.
To disable SSL 2.0 & 3.0 and to enable TLS 1.1 & 1.2, I had to run Regedit.exe and go to:
Computer\HKEY_LOCAL_MACHINE\SYSTEM\CurrentControlSet\Control\SecurityProviders\SCHANNEL\Protocols.
You’ll probably only see one key under Protocols – SSL 2.0 and in my case it only had a Clients key.
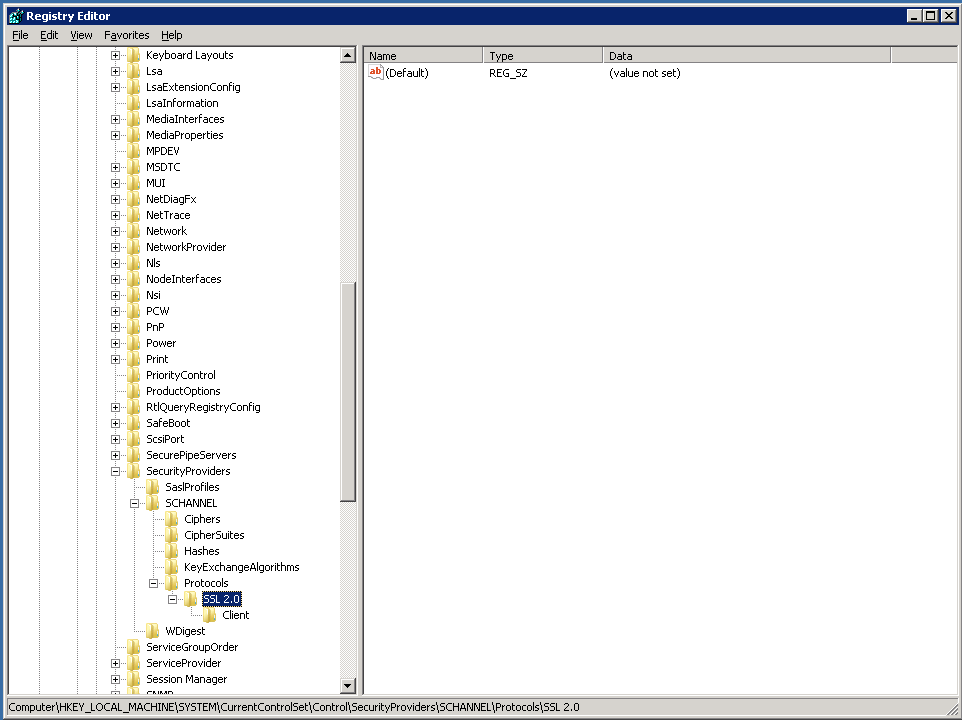
SSL 2.0 Initial Values
I created a Server key under SSL 2.0 and added a DWord name of “DisabledByDefault” with a data value of “1”. Now the server won’t attempt SSL 2.0 connections.
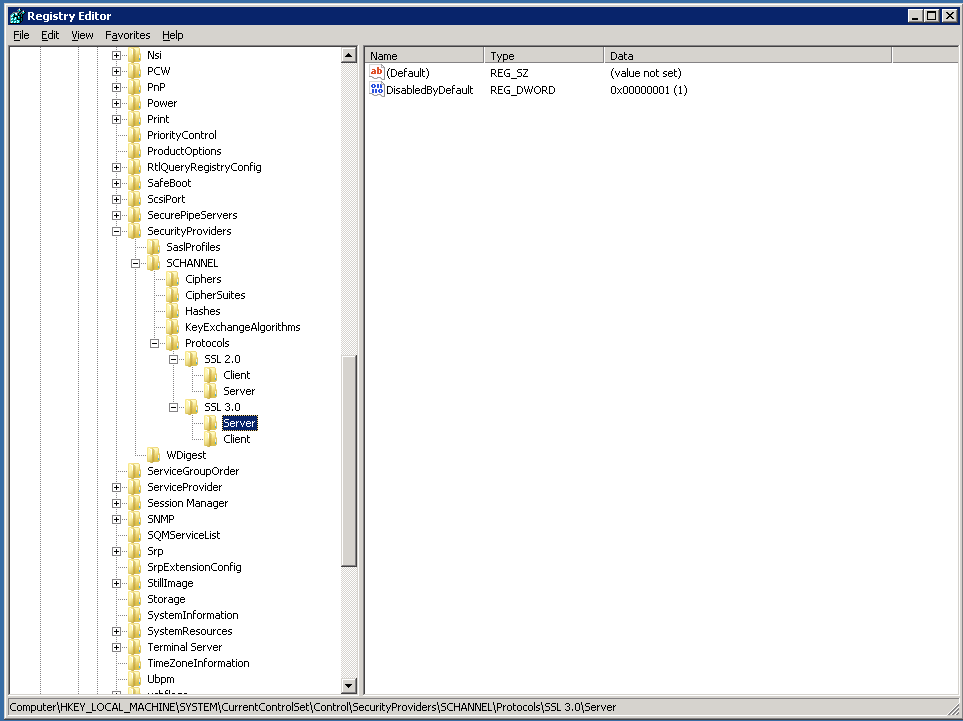
Disable Server SSL 2.0 and 3.0
To disable SSL 3.0 create a similar SSL 3.0 key under Protocols, create a key called Server under it and add a Dword with name DisabledByDefault with data value “1” there as well. No more SSL 3.0 served up now.
To enable TLS 1.1 and 1.2, you follow similar steps of creating TLS 1.1 and TLS 1.2 keys under Protocols and creating a Server key under each. This time, however, I added two Dword values under each of their Server keys. One named DisabledByDefault with a data value of “0” (we don’t want them to be disabled) and then add a second DWord named “Enabled” with a data value of “1” (the default is “0”, so you’ll need to change the value to “1” once you create the Dword entry).
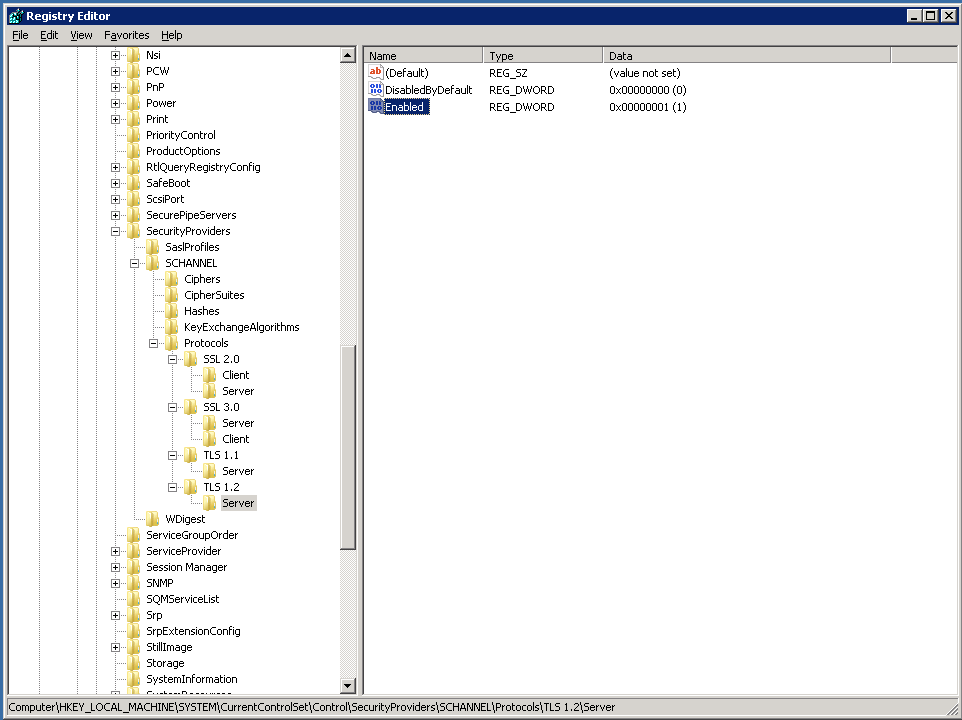
Keys to enable TLS 1.1 and 1.2
I closed Regedit – no need to “save” as it auto-saved for me.
Next we need to edit the group policy setting that determines which SSL cipher suites that the server will offer up. To edit the group policy on my stand alone server clicked Start -> Run and typed “gpedit.msc” to open the Windows group policy editor snap-in. The entry we want to modify is under:
Computer Configuration -> Administrative Templates -> Network -> SSL Configuration Settings
The entry we want to modify is “SSL Cipher Suite Order” which was “Not Configured” by default. This means that it falls back to the Windows Server default ciphers and ordering.
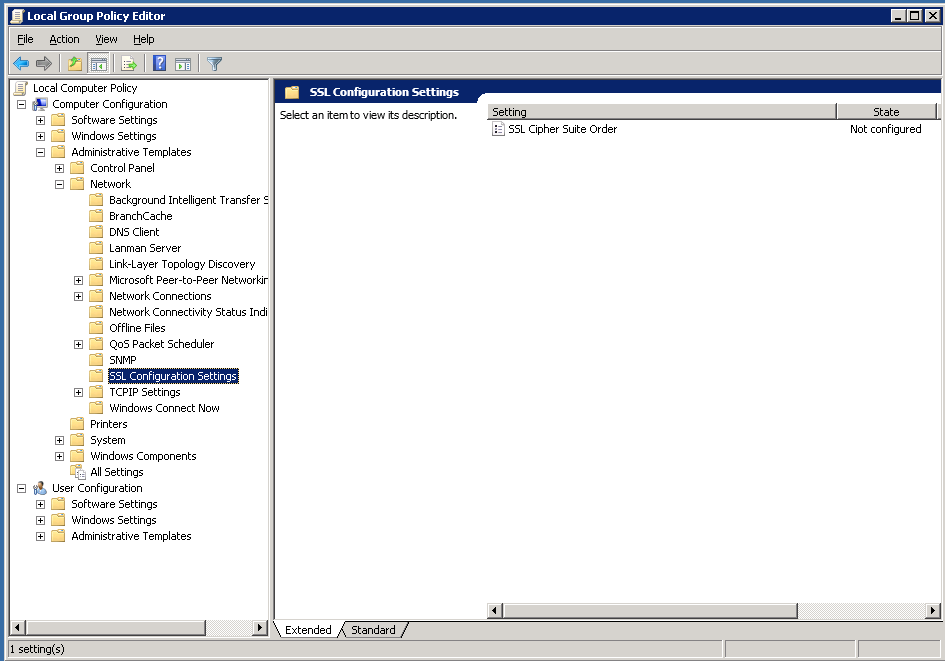
SSL Cipher Suite Order Default State
To only serve up ciphers that aren’t weak and that support Perfect Forward Secrecy, I had to choose a subset of ciphers. Luckily, Steve Gibson at GRC shared out a list of ciphers that met that criteria on his site at: https://www.grc.com/miscfiles/SChannel_Cipher_Suites.txt
One caveat is that the list that you paste into the group policy editor has to be a single line of comma separated values. No carriage returns or the like. I copied the text from Steve’s site into Notepad and then hit Home + Backspace for each line starting at the bottom until I got a single line of comma-separated values.
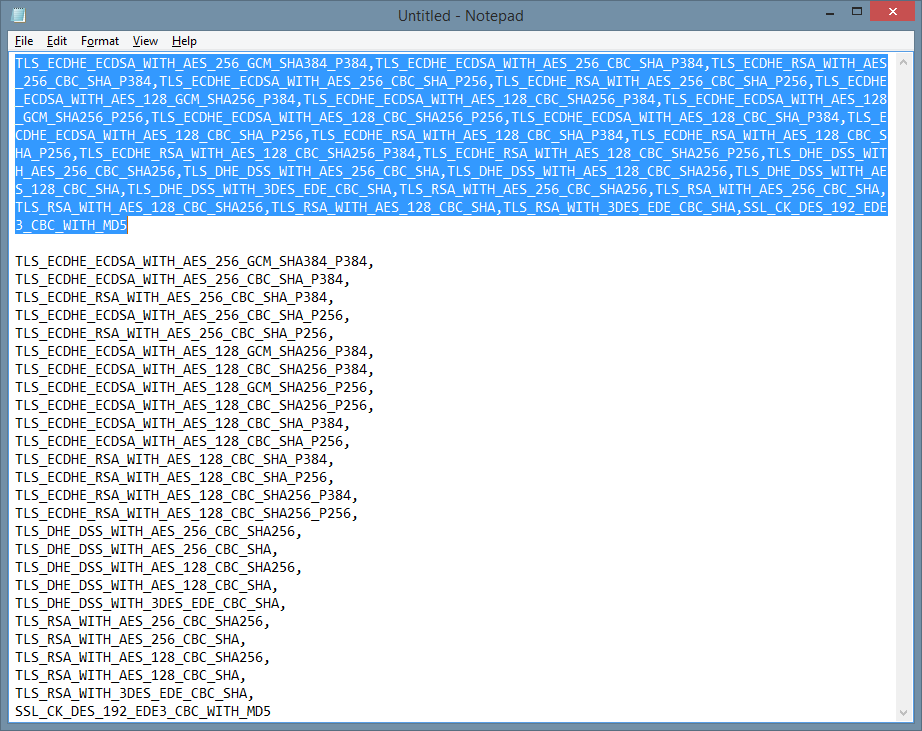
Cipher suites in a single line
Click the “Enabled” radio button, highlight the default values in the SSL Cipher Suites textbox and delete them, paste in the new values from Notepad (remember, the single line, no line breaks rule), click Apply and Save and we’re done.
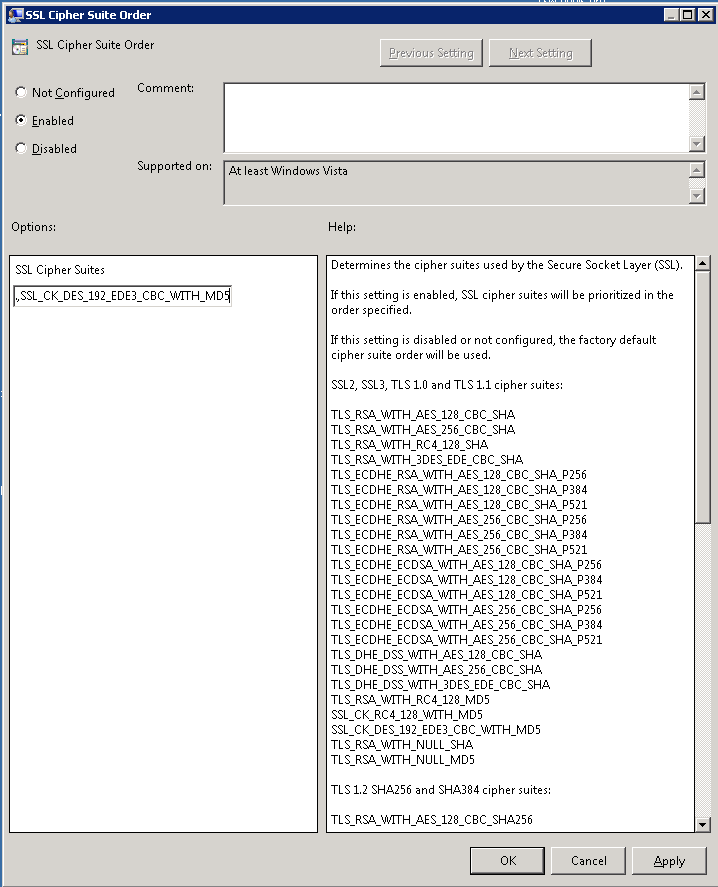
SSL Cipher Suite Order Enabled
I then closed the group policy editor MMC snap-in, rebooted the server (it won’t take until you reboot) and then went back and re-ran the Qualys SSL Labs test by clicking the “Clear Cache” link. It caches the results from the previous scan, so unless you click the link, you’ll just be looking at the previous scan results.
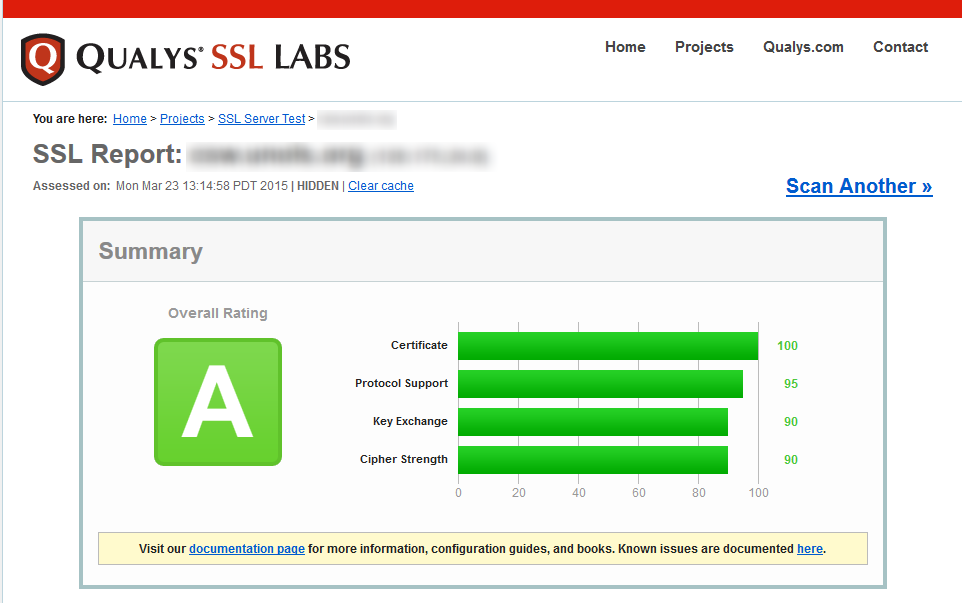
Qualys SSL Labs A Grade
Voila! We’ve gone from an “F” grade to an “A” grade. Whether the site is actually more secure or not is beyond the scope of this blog post, but if I am being asked to serve up an SSL secure site and it gets an “F” there would be some ‘splainin’ to do.
Hopefully this helps with understanding what steps were required for me to get the “A” grade.